Smart Sanitation IoT Ecosystem
Data-Driven Hygiene: An IoT-Enabled Public Restroom Feedback System


Project Overview
For any modern city, public sanitation is a key indicator of livability. A prominent Municipal Development Authority faced a persistent challenge: despite deploying cleaning crews, public restrooms suffered from inconsistent hygiene levels due to a lack of timely data.
Renderbit Technologies engineered a Restroom Feedback System (RFS) — a closed-loop IoT ecosystem that empowers citizens to rate cleanliness in real-time. By connecting physical feedback buttons to a cloud-based command center, we transformed a reactive maintenance schedule into a proactive, demand-driven operation.
The Solution: A “Listen-Analyze-Act” Grid
We moved the city from “Scheduled Cleaning” to “Feedback-Triggered Cleaning.”
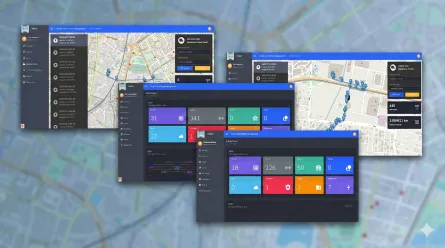
The Command Center (Geo-Spatial Monitoring) We equipped waste collection drivers with a specialized Android tool designed for accountability.
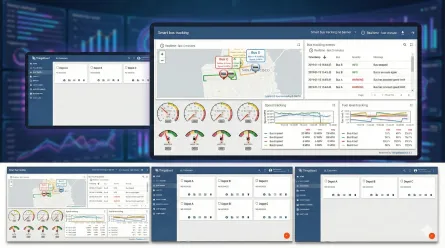
Live Map Visualization: The landing page features an interactive map displaying every deployed device. A color-coded pin system (Green for Clean, Red for Critical) allows admins to assess the city’s hygiene status at a glance.
Device Health Telemetry: Beyond cleanliness, the system monitors the health of the hardware itself, reporting battery percentages and signal strength (RSSI) to prevent downtime.
- The Alert Engine (Automated Dispatch)
Threshold-Based Triggers: We implemented a configurable logic engine. If a device reports “Dirty” or “Very Dirty” feedback above a specific threshold (e.g., >20% of users in 1 hour), the system automatically triggers an alert.
Instant Notifications: Alerts are dispatched via SMS and Email directly to the on-ground maintenance supervisor for that specific zone, closing the loop instantly.
- The Intelligence Layer (Reporting)
Comparative Analytics: The system allows admins to compare facility performance. We introduced “Device-to-Device” comparison reports to identify which contractors consistently underperform compared to the city average.
Trend Analysis: Daily, weekly, and monthly reports highlight peak usage hours, allowing the authority to roster more staff during high-traffic windows.
Technical Architecture & Strategic Rationale
We selected a stack designed for Scale and Cloud-Native Resilience.
| Component | Technology | Strategic Rationale |
|---|---|---|
| Cloud Infra | Google Cloud (GCP) | Kubernetes Orchestration: We deployed the system using Kubernetes to handle sudden spikes in data from thousands of concurrent devices without latency. |
| Containerization | Docker | Ensures portability and consistent deployment across development, staging, and production environments. |
| Backend | Node.js / Express | Non-Blocking I/O: Perfect for ingesting high-velocity IoT sensor streams (battery status, user clicks, keep-alive pings). |
| Frontend | React.js | Single Page Application (SPA): Provides a fluid, app-like experience for admins monitoring live data streams without page reloads. |
| Database | MongoDB | Time-Series Data: A NoSQL structure is optimized for storing millions of timestamped feedback events and generating aggregation reports. |
Core Focus
Civic Tech, Real-Time Monitoring, Predictive Maintenance
The Strategic Challenge: The 'Blind Spot' in Sanitation
- Latency in Response: A restroom could remain dirty for hours before a supervisor noticed, leading to citizen complaints.
- Lack of Accountability: Without digital logs, it was impossible to verify if cleaning staff attended to a specific location on time.
- Static Scheduling: Resources were allocated evenly, even though high-traffic zones required significantly more attention than low-traffic ones.
The Impact: Quantifiable Cleanliness
Renderbit’s solution turned sanitation into a metric-driven utility:
- Operational Agility: The "Alert Logic" reduced the average response time to dirty restrooms significantly by notifying staff before complaints escalated.
- Resource Optimization: Data revealed that certain restrooms were over-cleaned while others were neglected. The authority reallocated staff based on "Usage Intensity" rather than a flat roster.
- Hardware Reliability: Real-time battery monitoring ensured near-100% uptime for the feedback devices, preventing "dead" units from creating data gaps.


Ready to build a smarter city?
Renderbit builds the digital infrastructure that powers modern civic services.
Contact Us to discuss your Smart City strategy.Related Posts


See Our Work in Action.
Start Your Creative Journey with Us!
Renderbit Helper
Welcome!
How can I help you today?